📊 Charting Libraries
Discover products tagged with #Charting Libraries

D3.js
D3.js is a JavaScript library for producing dynamic, interactive data visualizations in web browsers. It makes use of the widely implemented SVG, HTML5, and CSS standards.

Bokeh
Bokeh is a Python library for creating interactive plots and data visualization on the web.

Epoch JS
Epoch JS is a powerful JavaScript library for time, date, and timeline based data visualization.
amCharts
amCharts is a JavaScript library for creating interactive charts and maps. It offers a wide range of chart types and customization options.

Google Charts
Google Charts is a web service that allows you to create a wide variety of interactive charts for your websites and applications.
NVD3
NVD3 is a JavaScript visualization library that allows you to build re-usable charts and graphs using D3.js.

RAWGraphs
RAWGraphs is an open-source data visualization framework built with the goal of making the visualization of complex data easy for everyone. It allows users to create custom and interactive visualizations from various data sources.

Highcharts
Highcharts is a popular JavaScript charting library that enables you to create interactive and visually appealing charts for web applications.

ZingChart
ZingChart is a JavaScript charting library that offers interactive and responsive charts for web applications.

ChartURL
ChartURL is a web-based tool for creating interactive charts and graphs easily.

CanvasJS
CanvasJS is a responsive HTML5 charting library that provides beautiful and interactive charts for web and mobile applications.

Vizzlo
Vizzlo is a web-based data visualization tool that helps users create professional charts, graphs, and infographics.

ZoomCharts
ZoomCharts is a data visualization software that offers interactive and dynamic charting capabilities.

Chart.js
Simple yet flexible JavaScript charting for designers & developers.

ChartBlocks
ChartBlocks is an online chart building tool that allows users to create interactive charts and graphs.

Popmotion
Popmotion is a JavaScript motion library that simplifies the process of creating animations and interactions for the web.

dc.js
dc.js is a JavaScript library for creating re-usable charts and chart components using d3.js.

Invantive Control for Excel
Invantive Control for Excel is a software solution that enables users to access and analyze real-time data from various sources directly within Excel.

FusionCharts
FusionCharts is a comprehensive JavaScript charting library that enables you to create interactive and visually stunning charts for web and mobile applications.

Visualis
Visualis is a powerful data visualization software that helps users to create stunning charts and graphs.

Evie by unDraw
Evie is a free and open-source tool to generate web templates using unDraw illustrations, providing a quick way to create beautiful landing pages.

ApexCharts
A modern JavaScript charting library to build interactive visualizations.

Plottable.js
Plottable.js is a flexible and interactive JavaScript charting library for building complex charts and visualizations.

nivo
nivo provides a rich set of dataviz components built with D3 and React. It is highly customizable and offers beautiful visualizations.
Charty
Charty is a powerful data visualization tool for creating stunning charts and graphs.

Power-user
Power-user is a software tool designed to enhance productivity and efficiency by providing advanced features for Microsoft Office applications.
particles.js
A lightweight JavaScript library for creating particles animations.

Kutools for Excel
Kutools for Excel is a powerful add-in that simplifies various tasks in Excel and enhances productivity.

Devart Excel Add-ins
Devart Excel Add-ins allow you to work with database and cloud data in Microsoft Excel as with usual Excel spreadsheets.

p5.js
p5.js is a JavaScript library that helps create visual and interactive art and designs.
think-cell chart
think-cell chart is a popular PowerPoint add-in for creating professional charts and presentations.
Charts Factory
Charts Factory is a powerful data visualization tool that helps users create beautiful and interactive charts for their data.

PlusX Excel Add-In
PlusX Excel Add-In is a powerful tool for enhancing Excel functionalities and automating tasks.
Aha! Visual Chart Tool
Aha! is a product roadmap software that helps product managers create visual charts for planning and strategy.
Jaime
Jaime is a comprehensive project management software that helps teams collaborate effectively.

Charte
Charte is a comprehensive charting software for data visualization.
Dragula
Dragula is a simple drag and drop library that allows you to quickly create drag-and-drop interfaces.

Aploris
Aploris is a powerful charting and analytics software for presentations and reports.

React D3 Library
React D3 Library is a library for incorporating D3 visualizations into a React application.
Business Functions
Business Functions is a software suite that offers a wide range of tools for financial modeling and analysis.

Charts by ls.graphics
Charts by ls.graphics is a data visualization tool that offers a wide range of customizable chart templates for presentations and reports.

GSAP
GSAP (GreenSock Animation Platform) is a JavaScript library for creating high-performance animations that work across all major browsers. It is known for its flexibility, ease of use, and powerful features.

TrueXL
TrueXL is a comprehensive software solution for data analysis and visualization.
Airt Magic
Airt Magic is a powerful software for managing air travel bookings and schedules efficiently.

Three.js
Three.js is a popular JavaScript library used for creating 3D graphics on the web.
The Excel Utilities
A comprehensive suite of tools for Excel users to enhance productivity and efficiency.

Zebra BI
Zebra BI is a powerful reporting and data visualization tool that enhances the capabilities of Excel and Power BI.
FastCharts
FastCharts is a data visualization software that allows users to create interactive charts and graphs quickly.

OrgWeaver
OrgWeaver is a software for organizational design, restructuring, and transformation. It helps organizations visualize and analyze their current structure, design new structures, and simulate the impact of changes.

jqPlot
jqPlot is a plotting and charting plugin for the jQuery Javascript framework.
jQuery Sparklines
jQuery Sparklines is a jQuery plugin that enables you to create small inline charts directly in the browser.
AFreeChart
AFreeChart is a free and open-source charting library for Java applications.

AndroidPlot
AndroidPlot is a charting and graphing library for Android applications.

shinobicharts
ShinobiCharts is a powerful charting library for iOS and Android apps, providing a wide range of customizable charts.

Teechart
TeeChart is a charting library that offers a wide range of chart types for various platforms.
ios-linechart
iOS LineChart is a popular open-source library for creating interactive line charts in iOS applications.
think-cell
think-cell is a software that helps create professional PowerPoint charts, such as waterfall, Gantt, and Marimekko charts, easily and efficiently.

Atlas charts
Atlas charts is a data visualization software that helps users create interactive charts and graphs for data analysis.

Zdog
Zdog is a minimalist 3D engine for creating simple shapes and designs. It is lightweight and easy to use.

TradingView Lightweight Charts
A powerful financial charting library with a small footprint for displaying time-series data.

KoolChart
KoolChart is a JavaScript charting library that provides various chart types and customization options for data visualization.

Circos
Circos is a software package for visualizing data in a circular layout, widely used in genomics and bioinformatics.

Victory
Victory is a comprehensive project management tool that helps teams collaborate and stay on track with their tasks and deadlines.
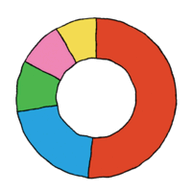
Chart.xkcd
Chart.xkcd is a chart library that creates charts in the style of xkcd comics. It offers a fun and unique way to visualize data.
Substance
Substance is a collaborative writing and editing platform that allows users to work on documents in real-time.
liveGap Charts
liveGap Charts is a tool for creating interactive charts and graphs easily.

Vega Visualization Grammar
Vega is a visualization grammar, a declarative format for creating, saving, and sharing interactive visualization designs.

Rellax.js
Rellax.js is a lightweight, vanilla JavaScript parallax library that allows you to create smooth parallax effects on elements as you scroll.

Pixi.js
Pixi.js is a fast 2D rendering engine that works across all modern web browsers. It is widely used for creating interactive graphics and games.

KPI Dashboard in Excel
A tool to create interactive Key Performance Indicator dashboards using Excel

Velocity.js
Velocity.js is an animation engine that works with and without jQuery. It is known for its high performance and smooth animations.

Glottologist
Glottologist is a linguistic analysis software that helps researchers and linguists analyze and study languages.

Frappé Charts
Frappé Charts is a modern and responsive charting library with a simple API. It is suitable for visualizing time-series data.

Paths.js
Paths.js is a library to generate SVG paths and parse path strings. It provides a simple API to create complex shapes and charts.

Raphael
Raphael is a JavaScript library that simplifies working with vector graphics on the web. It provides a convenient API for creating and manipulating SVG graphics.

Quick Dashboard Charts for Excel
Quick Dashboard Charts for Excel is a tool that allows users to create dynamic charts and dashboards directly in Excel.

JSCharting
JSCharting is a JavaScript chart library that offers a wide range of interactive chart types and customization options.

Magic Animations CSS3
Magic Animations CSS3 is a library that provides a wide range of CSS animations to enhance user interfaces.

Chartist.js
Flot
FnordMetric

Mekko Graphics

JS Charts

Image Charts
AmCharts JavaScript Stock Chart

RGraph

UpSlide

Shield UI Charts

Chartloop

Custom Graph for Figma

Plotly.js

Styled chart

Animo.js

Ceaser

Move.js

Stylie

ChartExpo⢠For Google Sheets

Charts.css

QuickChart
